Nautical charts are fine for navigation, but when it comes to fishing Scientific Fishery Systems (SciFish) has taken it a step beyond with the latest in bottom mapping software. In contrast to standard raster charting packages, the vector based Fishtrek 98 system integrates detailed bathymetric maps, GPS interface and automated catch logging and mapping features into one comprehensive fisheries mapping package.
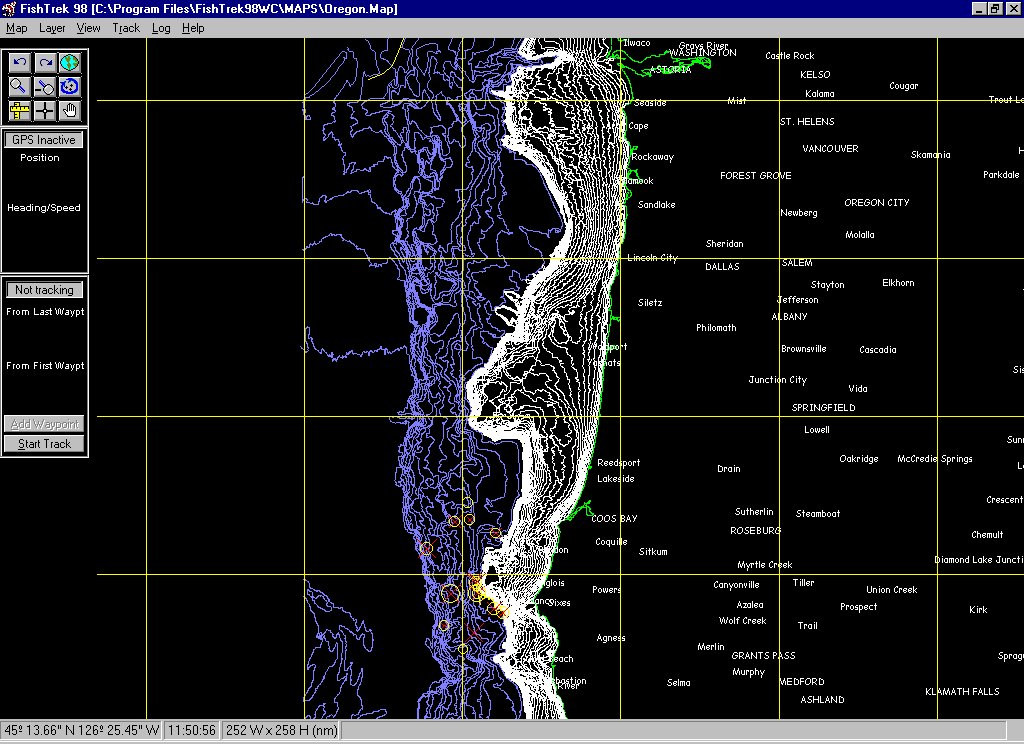
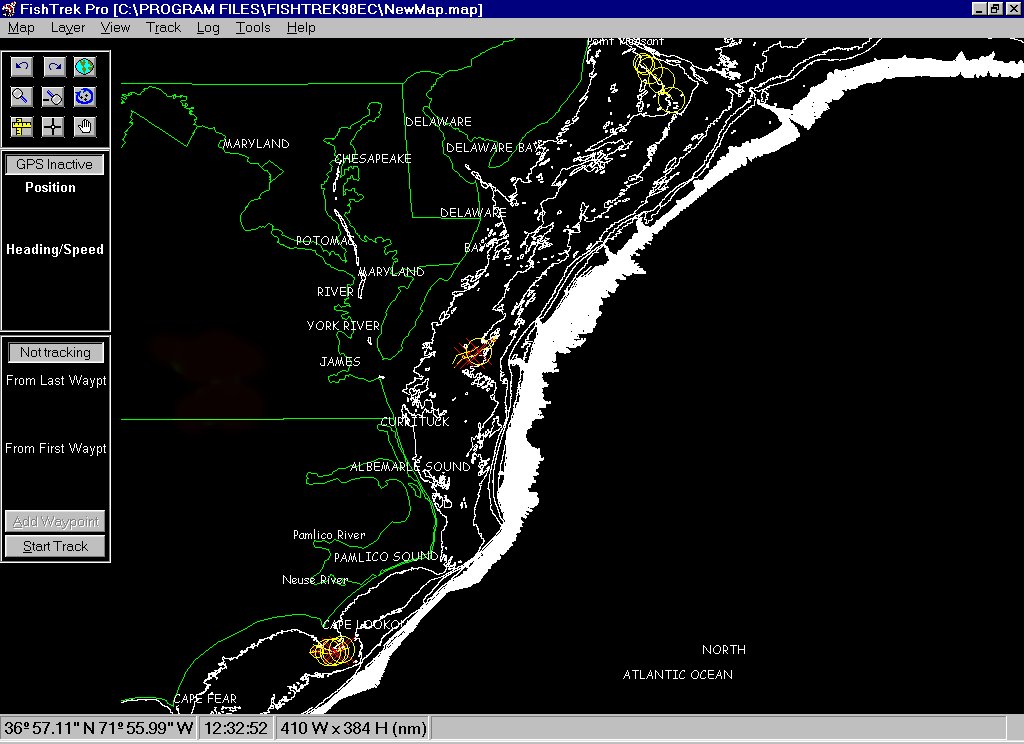
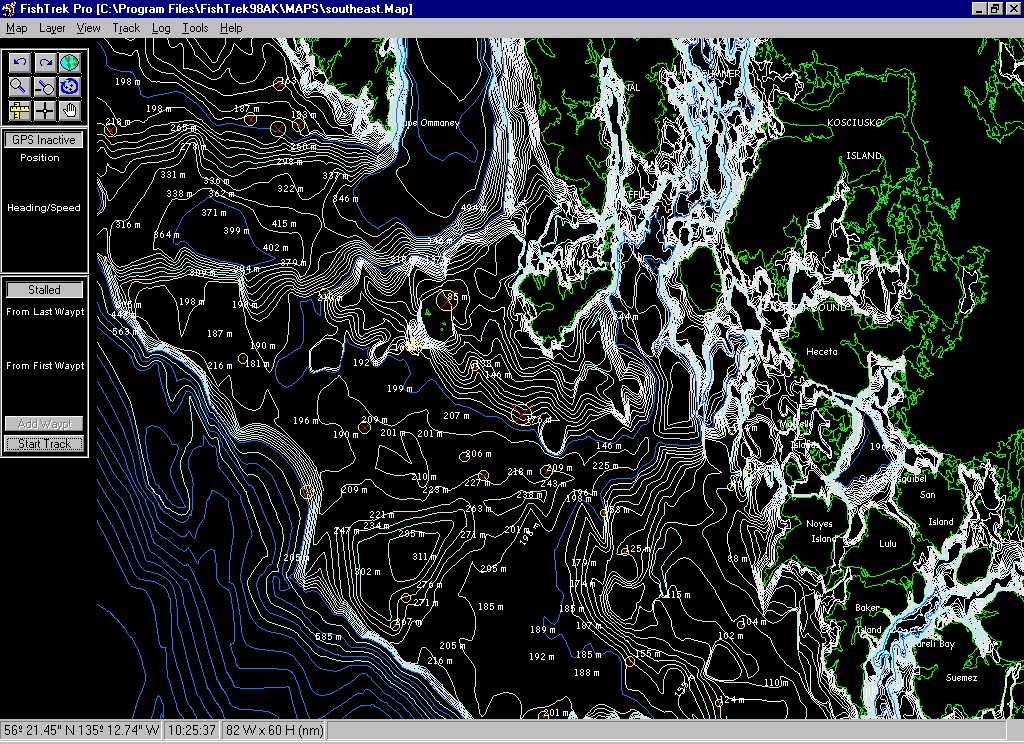
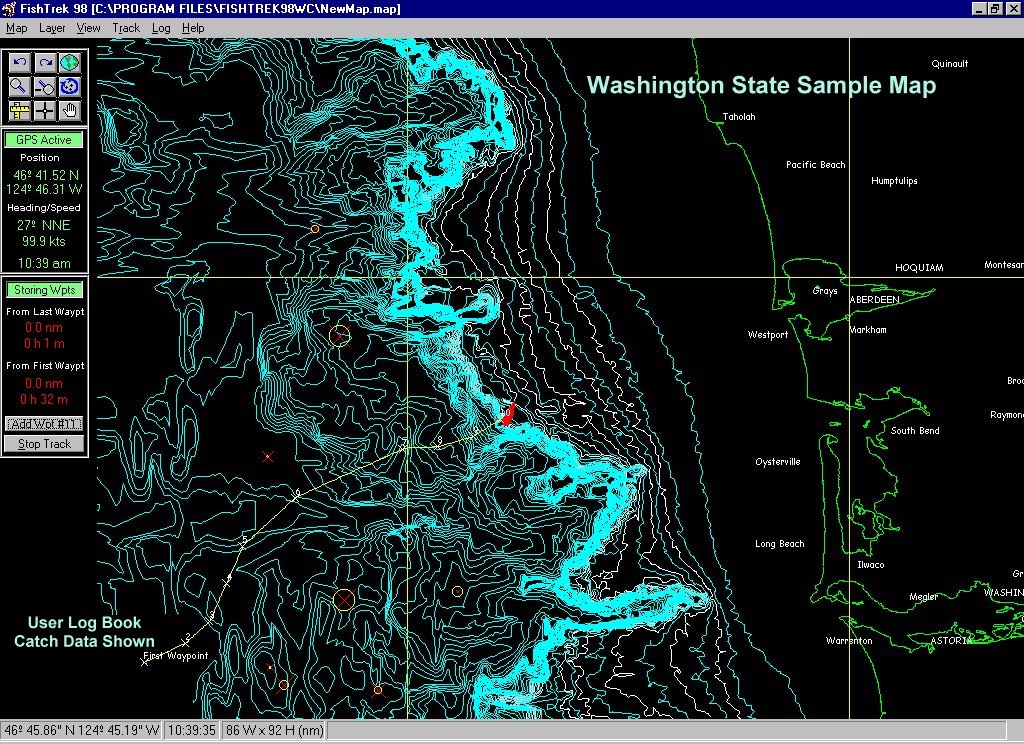
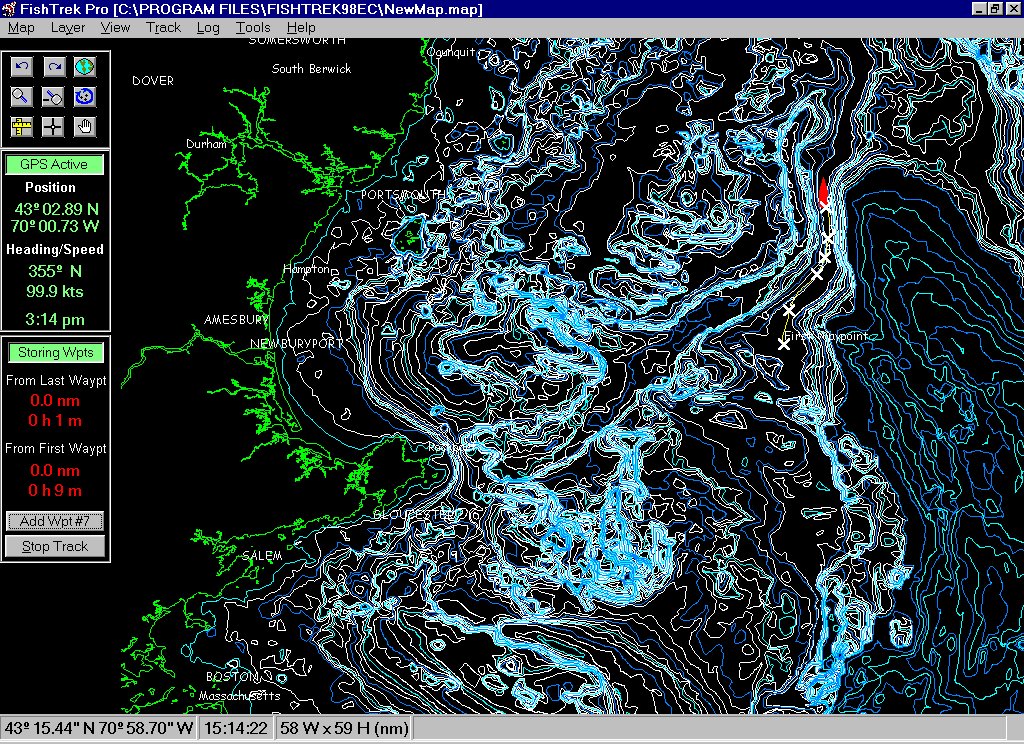
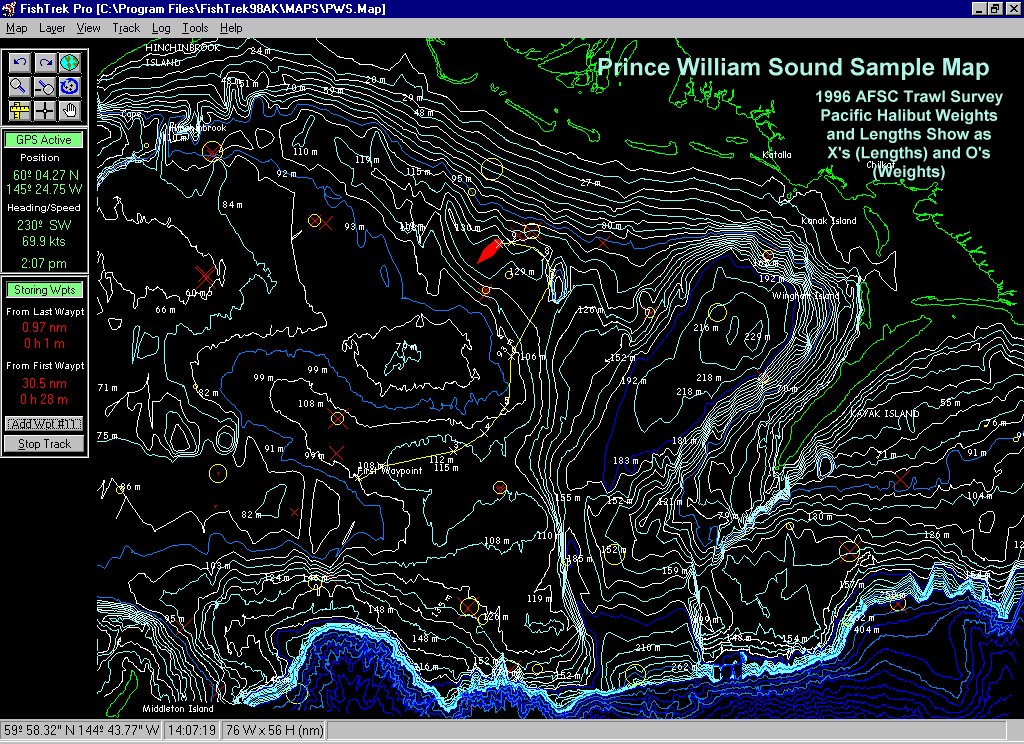
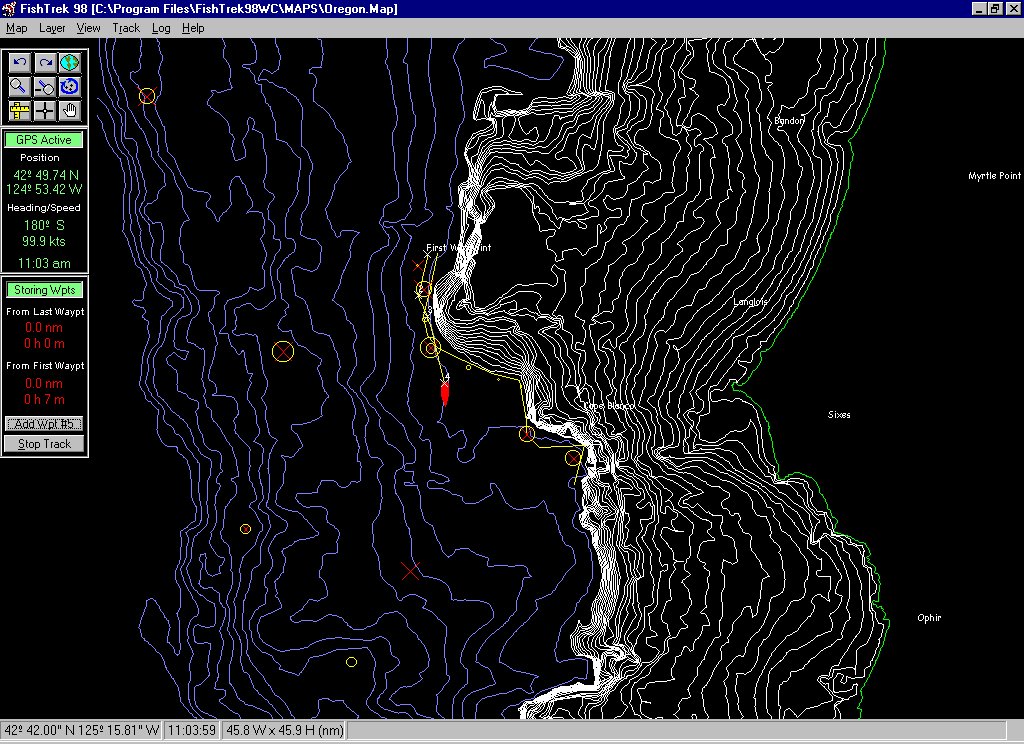
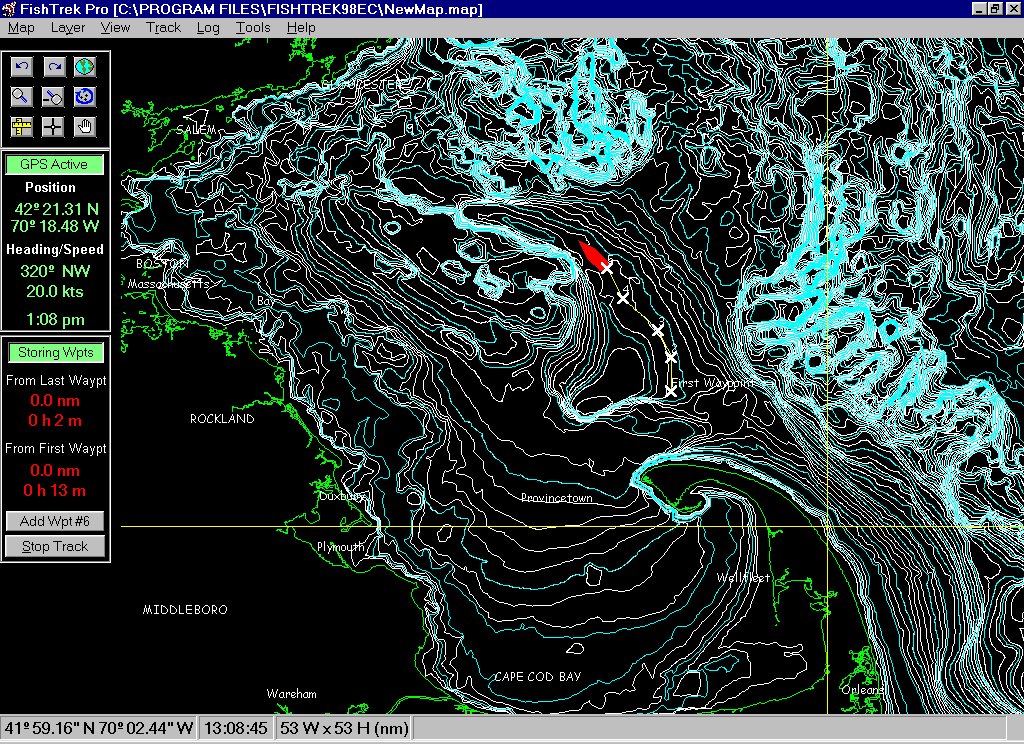
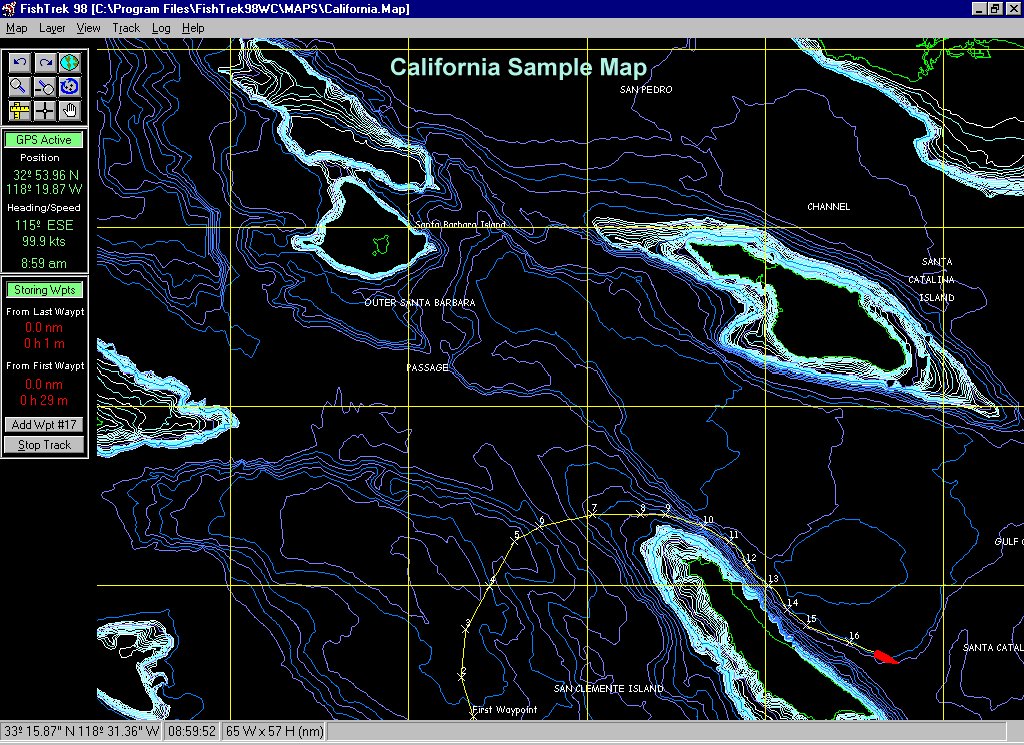
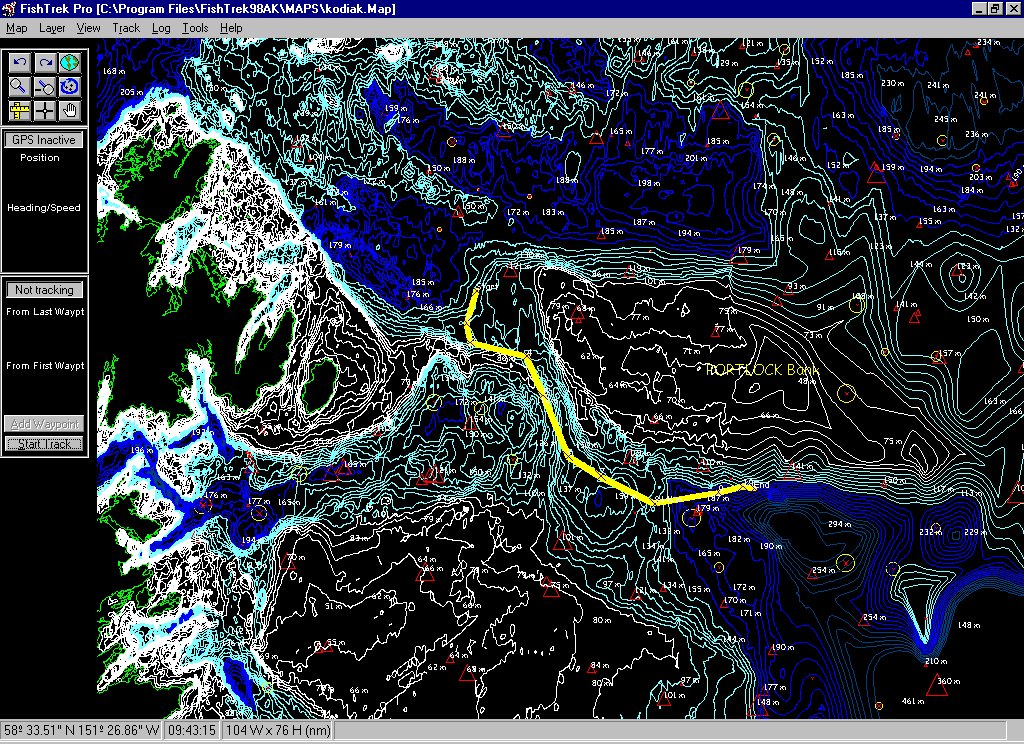
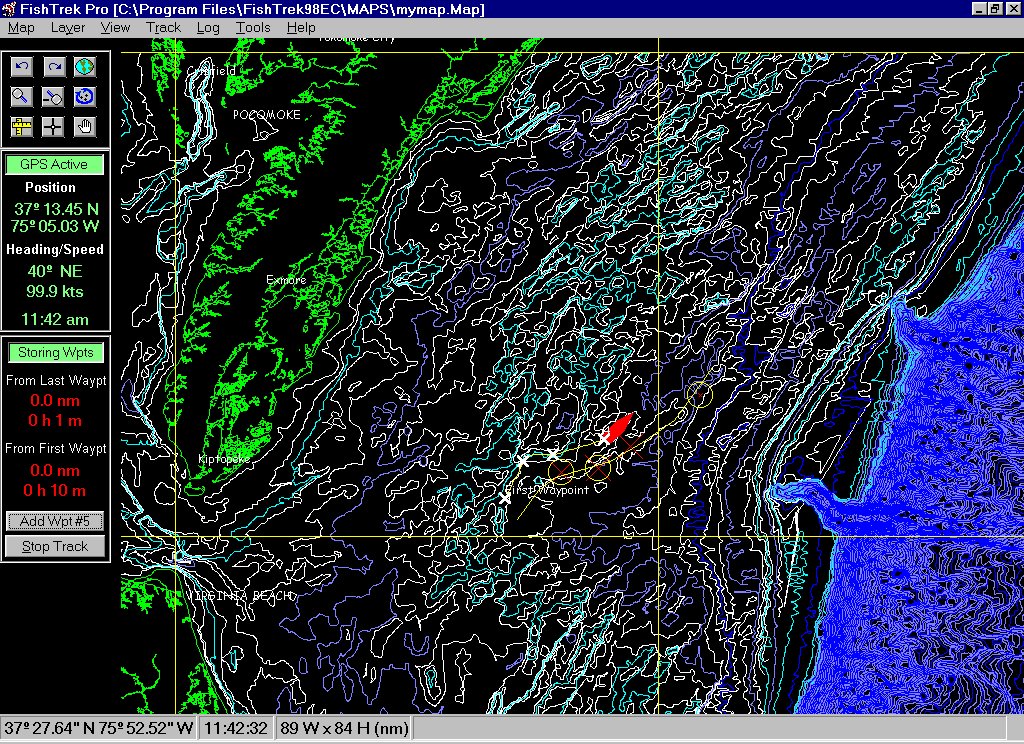
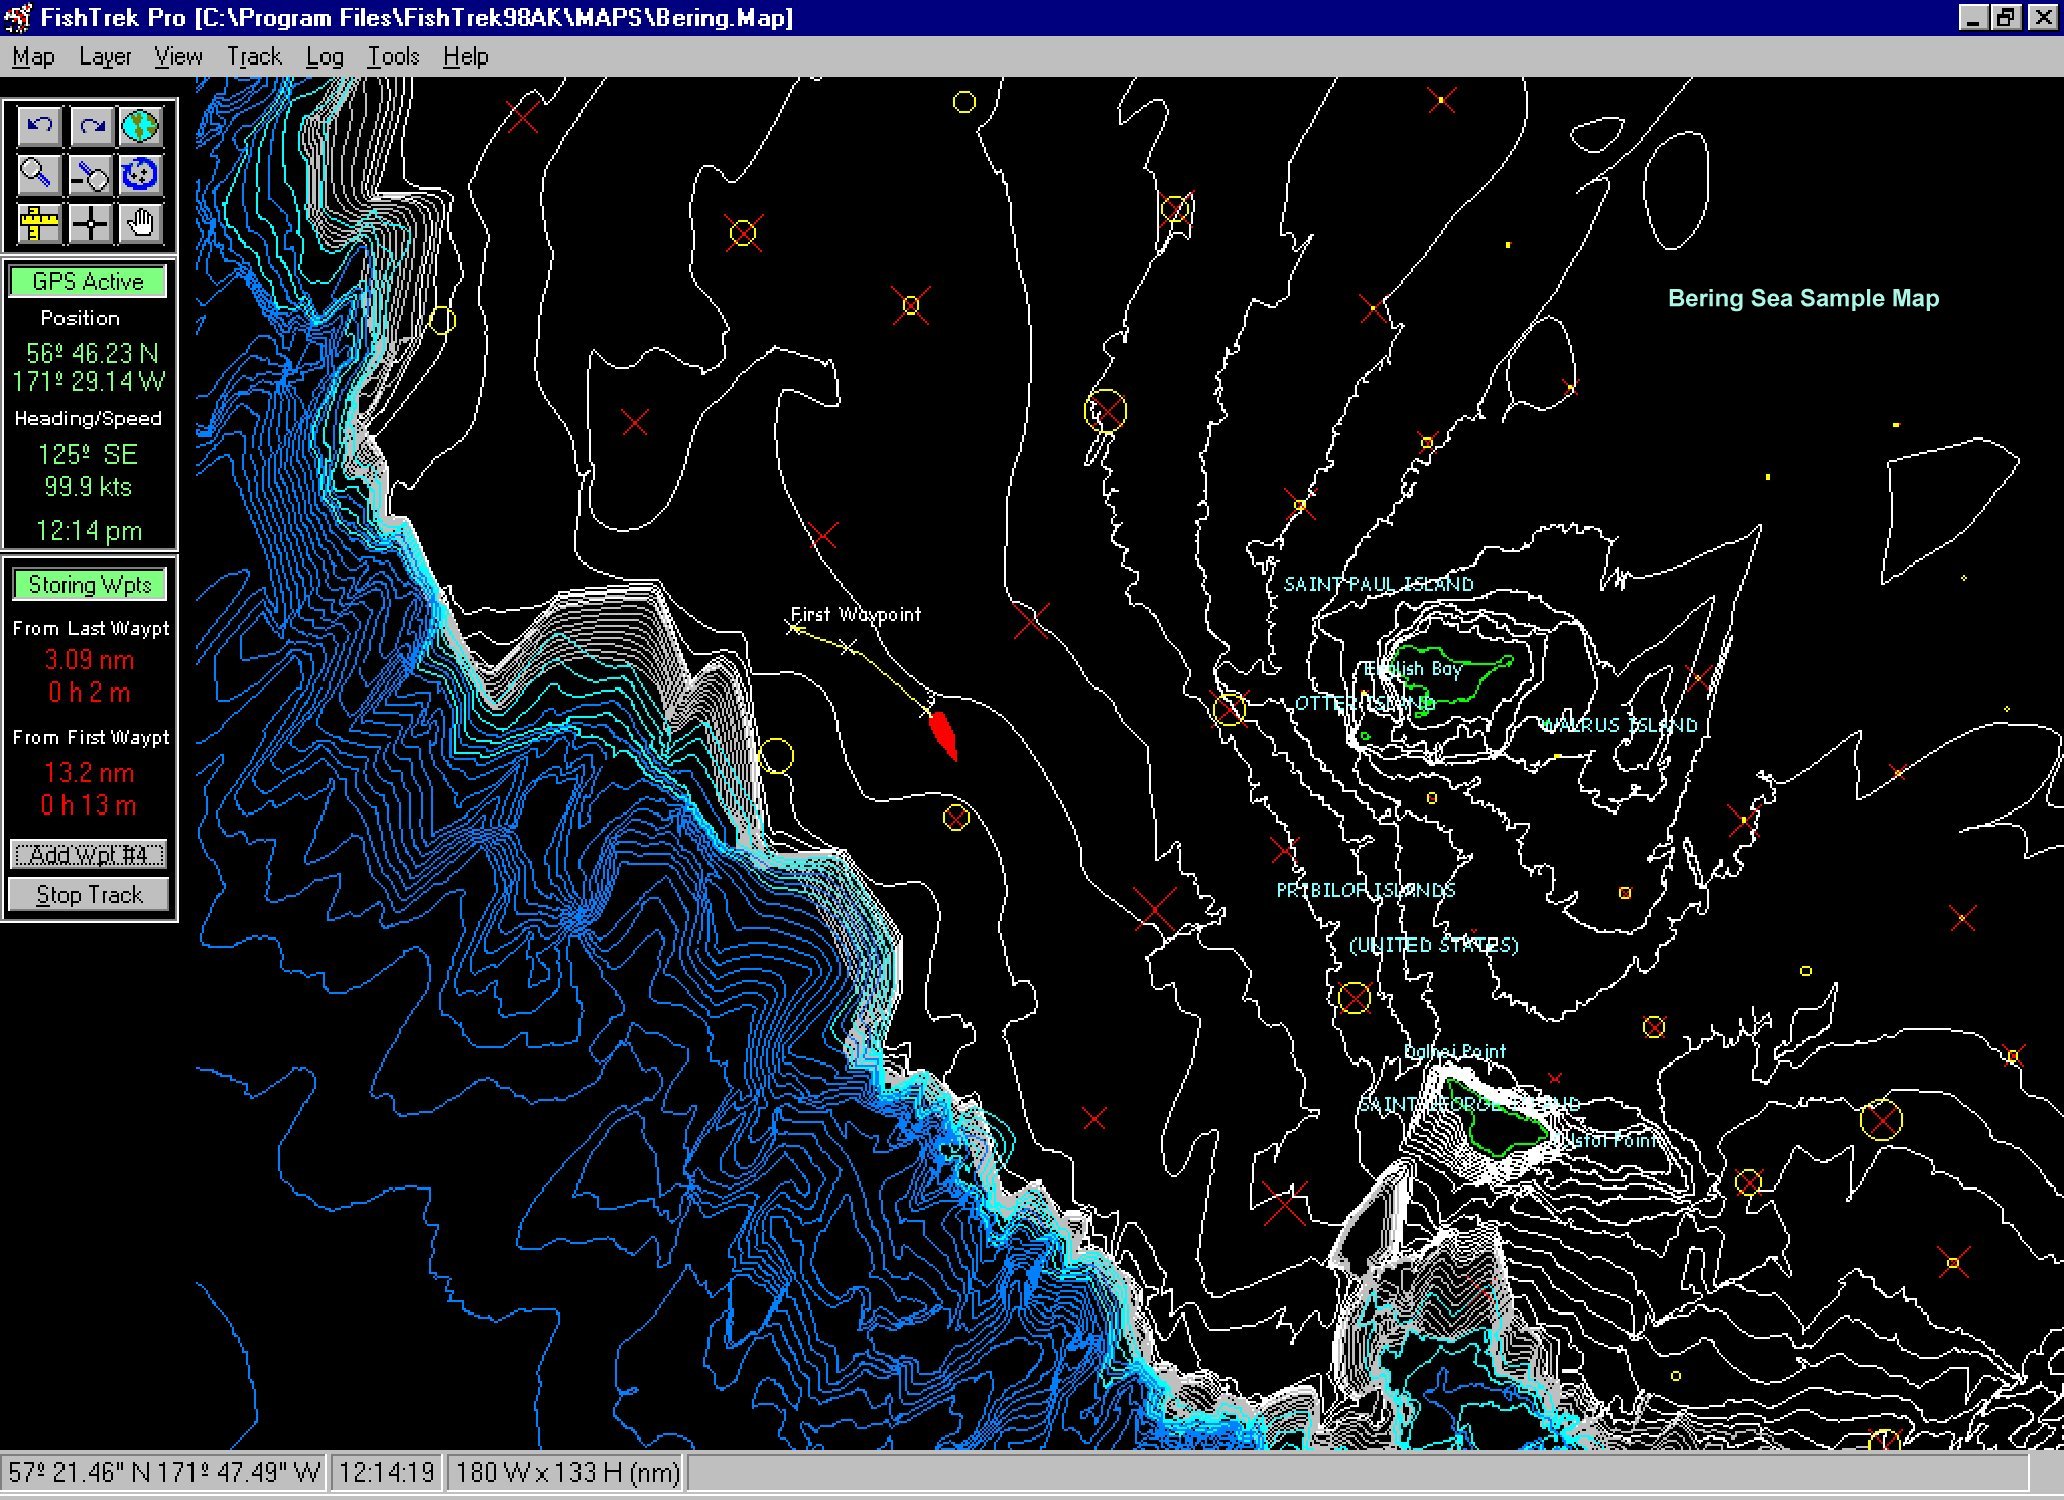
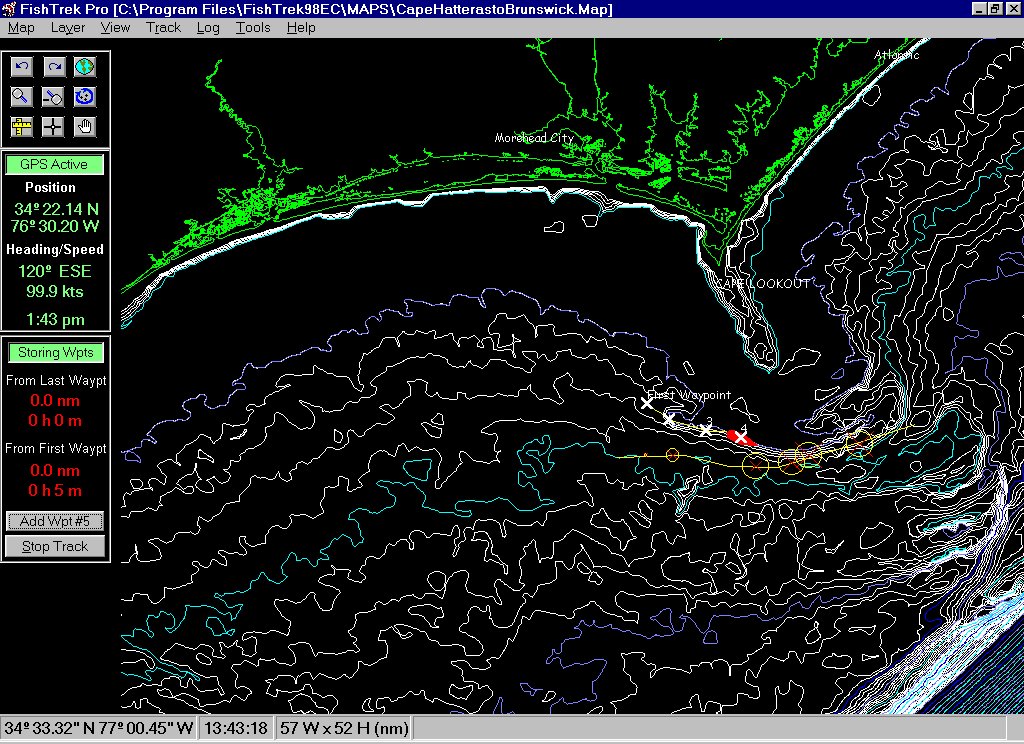
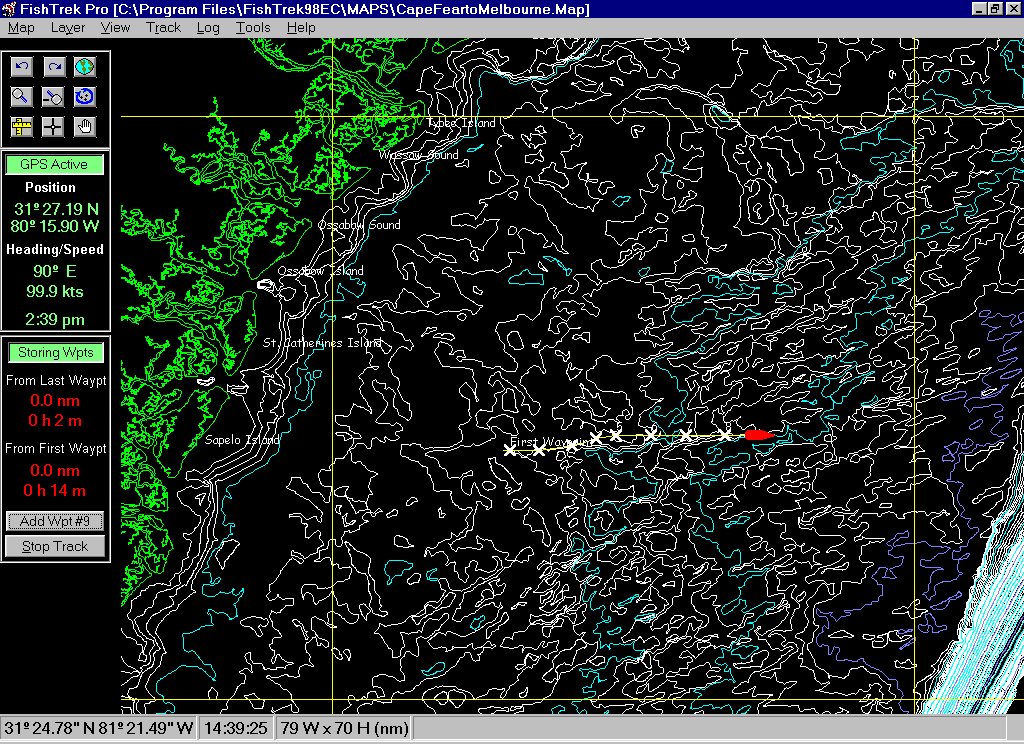
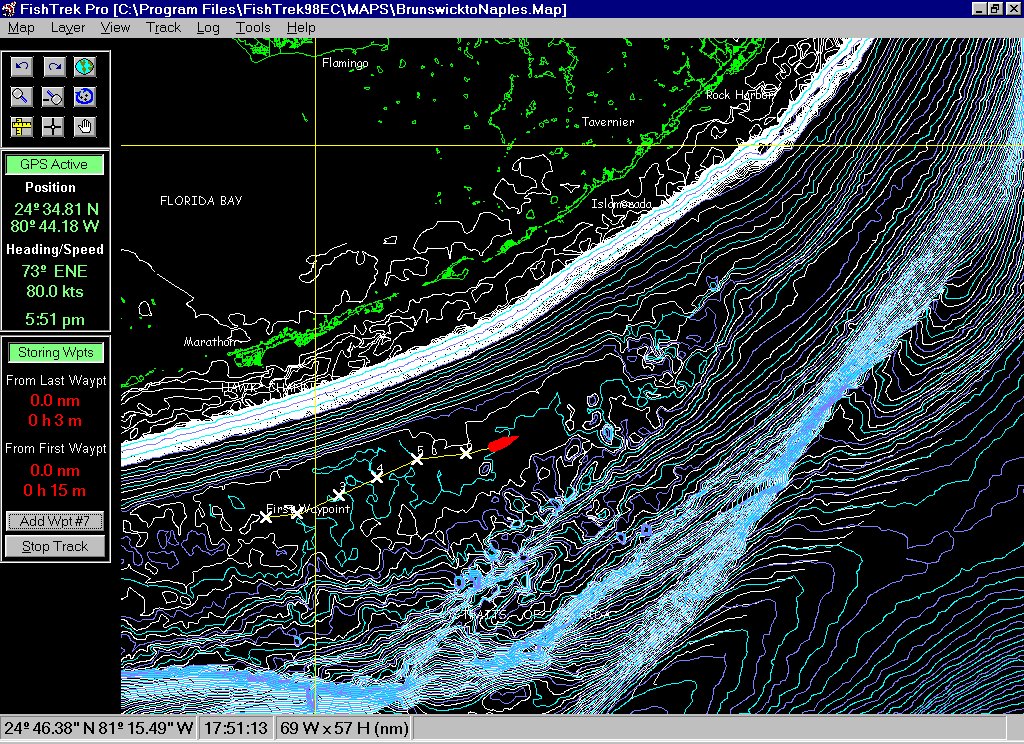
FishTreks high-resolution bathymetric maps show fisherman sea bottom structure for up to 17 major U.S fishing grounds. The data used to create these maps was taken from NOAA ship sounding surveys and represents one of the most accurate bathymetric sets available anywhere. Detailed bottom contours reveal canyons, ledges and banks in detail. Selectable contour intervals provide a variety of viewing options, and adjustable display ranges colorfully highlight depths of interest. Changing maps for more detail is no longer necessary. Wide geographic coverage maps, and full zoom capabilities enable users to simply zoom in as needed without the loss in resolution associated with raster type charts. New real time vessel display allows skippers to accurately position their vessel and gear over bottom structure not visible on ordinary nautical charts.
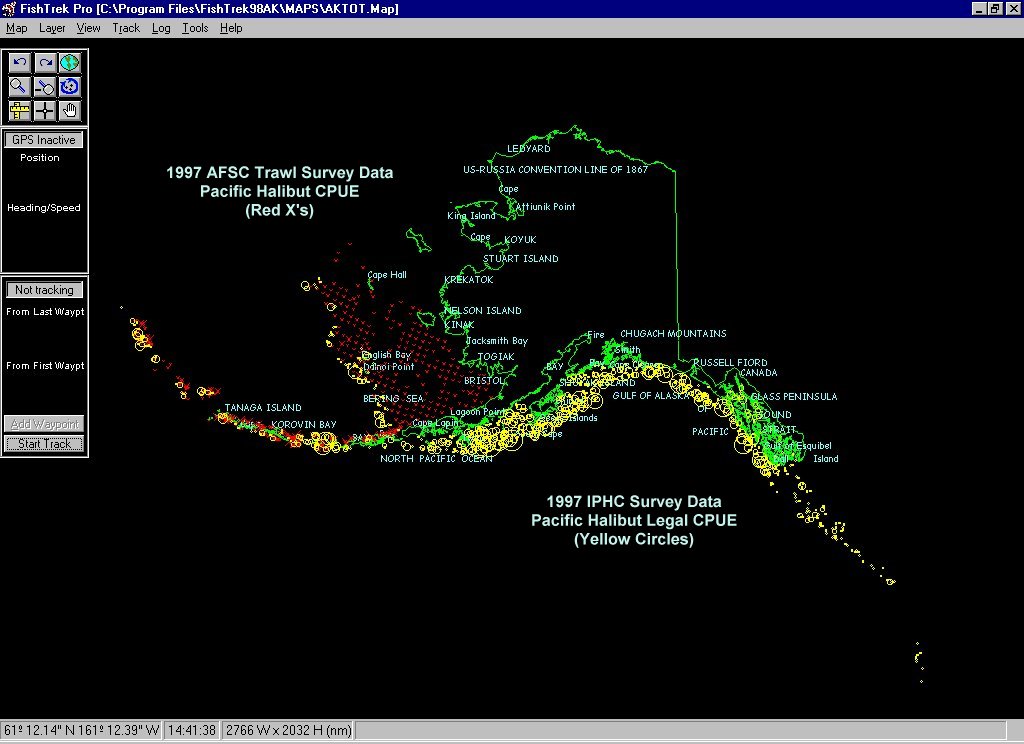
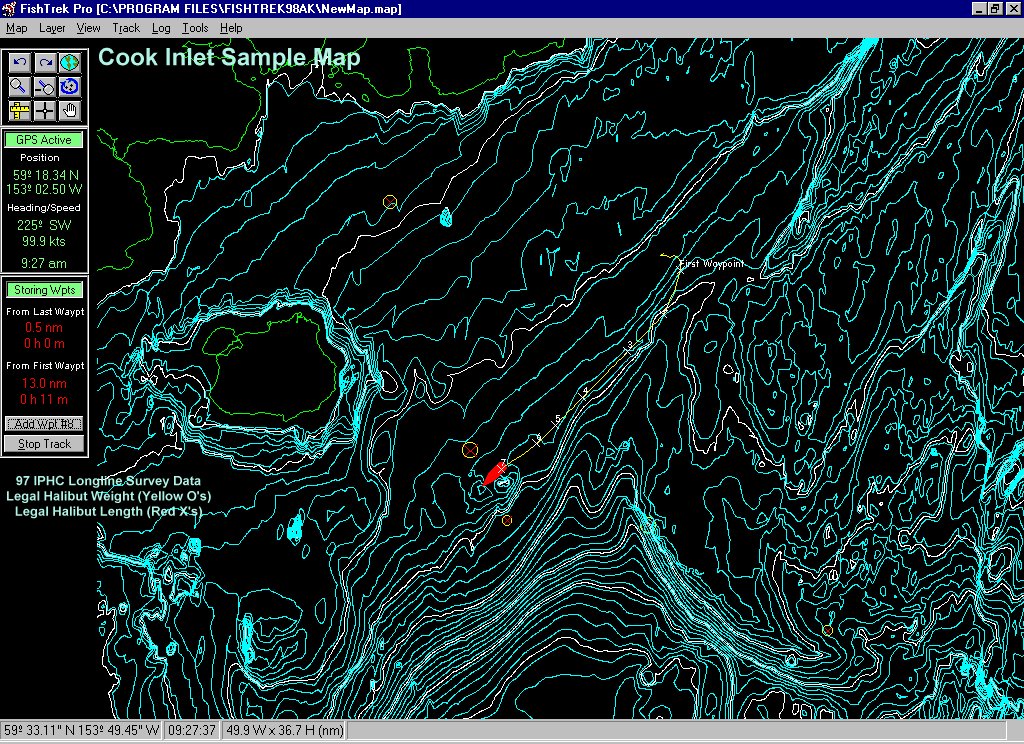
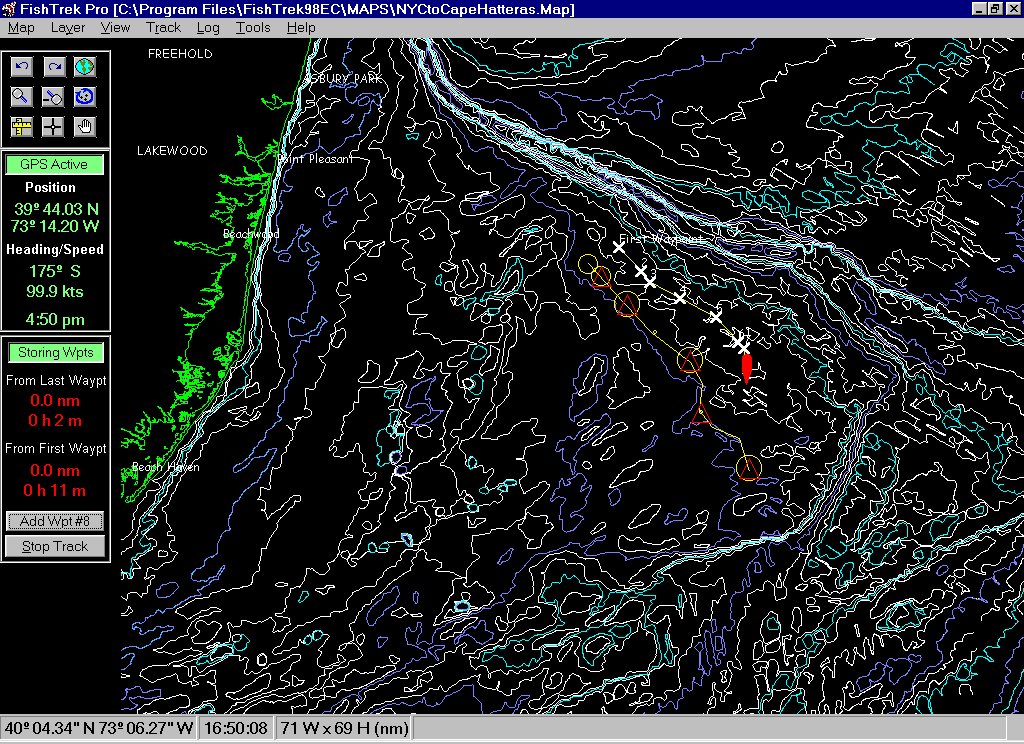
FishTrek 98 makes it fast and easy to display years of important fishing information and locations on detailed bottom maps of their fishing grounds. A unique catch plotting feature lets users selectively plot catch data by species, date, time of year, average weight, length, gear type, or even compare multiple species for a detailed display of catch trends by area. With vector mapping systems all map information is displayed in layers allowing users to display only desired fishing information, reducing map clutter and enhancing information analysis. Catch information can be quickly logged either as you fish or later by recorded position. Pot fisherman will find this feature especially useful in mapping pot layout and tracking individual catch rates by pot. FishTreks report generator quickly displays and prints detailed catch reports in a variety of standard or custom formats. Alaska versions include both trawl and IPHC halibut survey data sets in addition to over 1700 reported snag locations with depths.
FishTrek Pro version includes Ocean Contour, an add on module that allows users to create their own bathymetric maps for any area using a step-by-step wizard. Ocean Contour integrates GPS positioning and NMEA depth sounder inputs to accurately survey and contour the bottom as you fish or cruise an area. These maps can be named and saved, or later added to as additional depth data is recorded. This exclusive mapping feature will prove to be a tremendous asset to any fisherman working areas that lack detailed NOAA survey data. In addition to recording depth information, Ocean Contour will also collect and map sea surface temperature points as displayed by the depth-sounding unit. Temperature points can be displayed on bathymetric maps as contours text or both.
To Order: Click here to order FishTrek.
For More Information: